

WindESCo Hits 64
WindESCo now runs 64 individual checks on our Customer’s SCADA to uncover turbine performance anomalies across the entire wind turbine system,...
2 min read

WindESCo looks at high speed data to improve our performance analytic results of wind turbines. We have a recent customer that was concerned that they weren't generating as much power as they expected, so they wanted us to run the 60+ checks in Find, Fix, Measure to see what we could do to identify opportunities for improvement.
One of the issues we found is substantial rated power deviations. Whenever the power mode switched, the turbine would begin to shutdown by increasing pitch angle and reducing rotor speed and power. The turbine would quickly approach zero power, but would then come back to the power level it was trying to switch to, all happening in about one minute.
This site went through this power mode change constantly, and we calculated that this unexpected power drop could have a significant impact on the energy output at the farm. We realized that this looks like a fundamental issue with the behavior of the turbine. And it happens on every turbine every time it switches power levels.
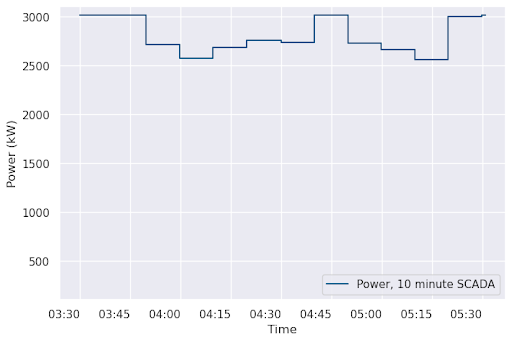
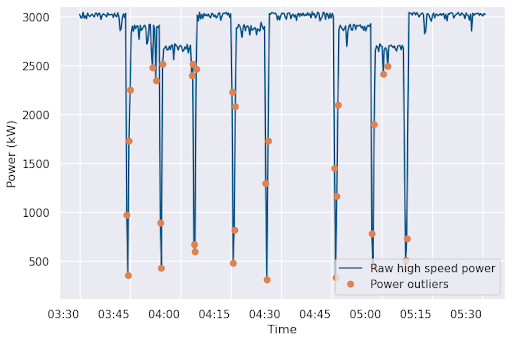
| 10 Minute Data | High Speed Data |
|---|---|
|
|
The customer is aware of the power mode switching looking at their event logs, however the event logs don’t say what the expected target power is during these events, so it’s impossible to know if the turbine has adjusted to the correct levels. The customer would look at the power curve using 10-minute data averages and see that it’s off the OEM power curve. The time periods align with a known event, but there isn’t enough information to solve the problem. However, with the high-speed data, we can go in and see the power drop between 2-3% at each event creating a 4% loss over the time window shown in this example, which shows 8 events over two hours costing the customer 4% power loss or thousands of dollars per turbine. For a full year, these issues lost the customer almost 2% of AEP, which, for a 50 turbine farm, over 10 years since commissioning, would be $2.5 million in lost revenue.
In this case we would show this data to the OEM. This is compelling data that the OEM should act on and fix because it’s such a fundamental problem in the behavior of the control system of the turbine. It requires a customer-OEM conversation in which we’re happy to join and facilitate.
If you’re interested in what your high speed data says about your turbine or site performance, contact us to run our analytics on your high speed data and we’ll report on every anomaly we find, showing you the evidence and the actions to take to increase AEP.
Contact us to learn more.
WindESCo now runs 64 individual checks on our Customer’s SCADA to uncover turbine performance anomalies across the entire wind turbine system,...
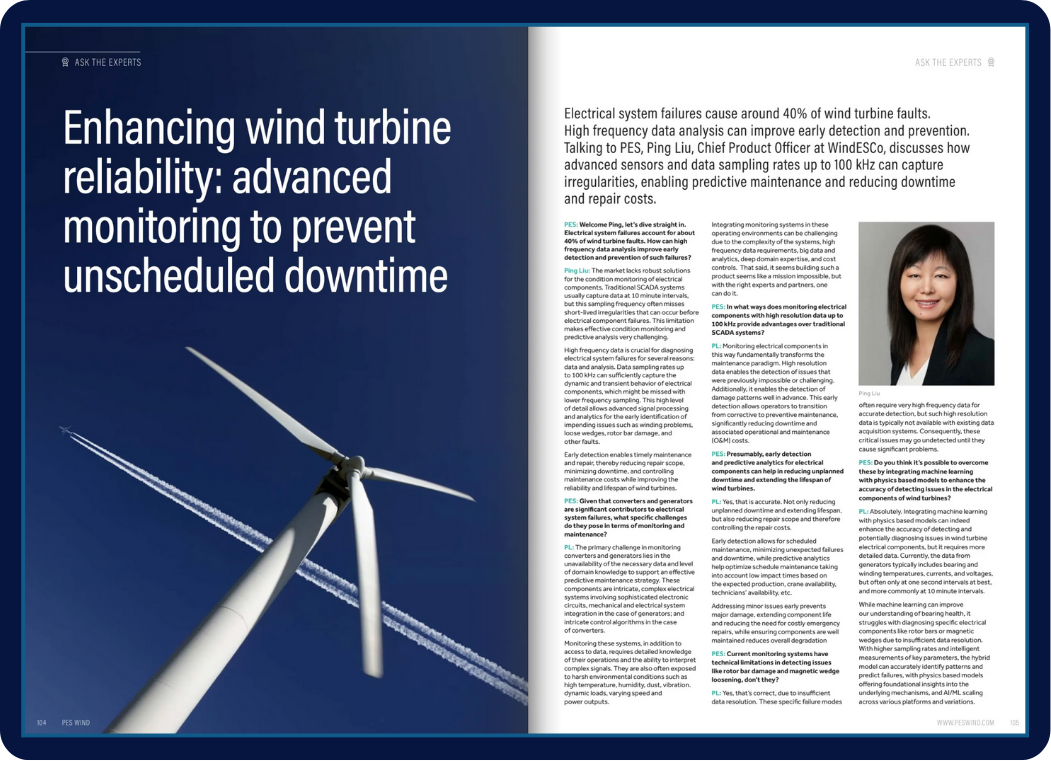
In a recent "Ask the Experts" interview with PES Wind (Issue 3, 2024), our Chief Technology Officer, Ping Liu, discusses how advanced sensors and...

On September 25, 2024, WindESCo's Senior Technical Lead in EMEA, Zuri Zugasti, shared fascinating insights at the WindEnergy Hamburg conference,...