
A deep dive into the different elements that impact your power curve certification
This article is part of a multi-part series to deep dive around the question - "Why isn't my site achieving my P50, P90 and energy estimate?". In our last
Site calibration and measurement sectors (and exclusions)
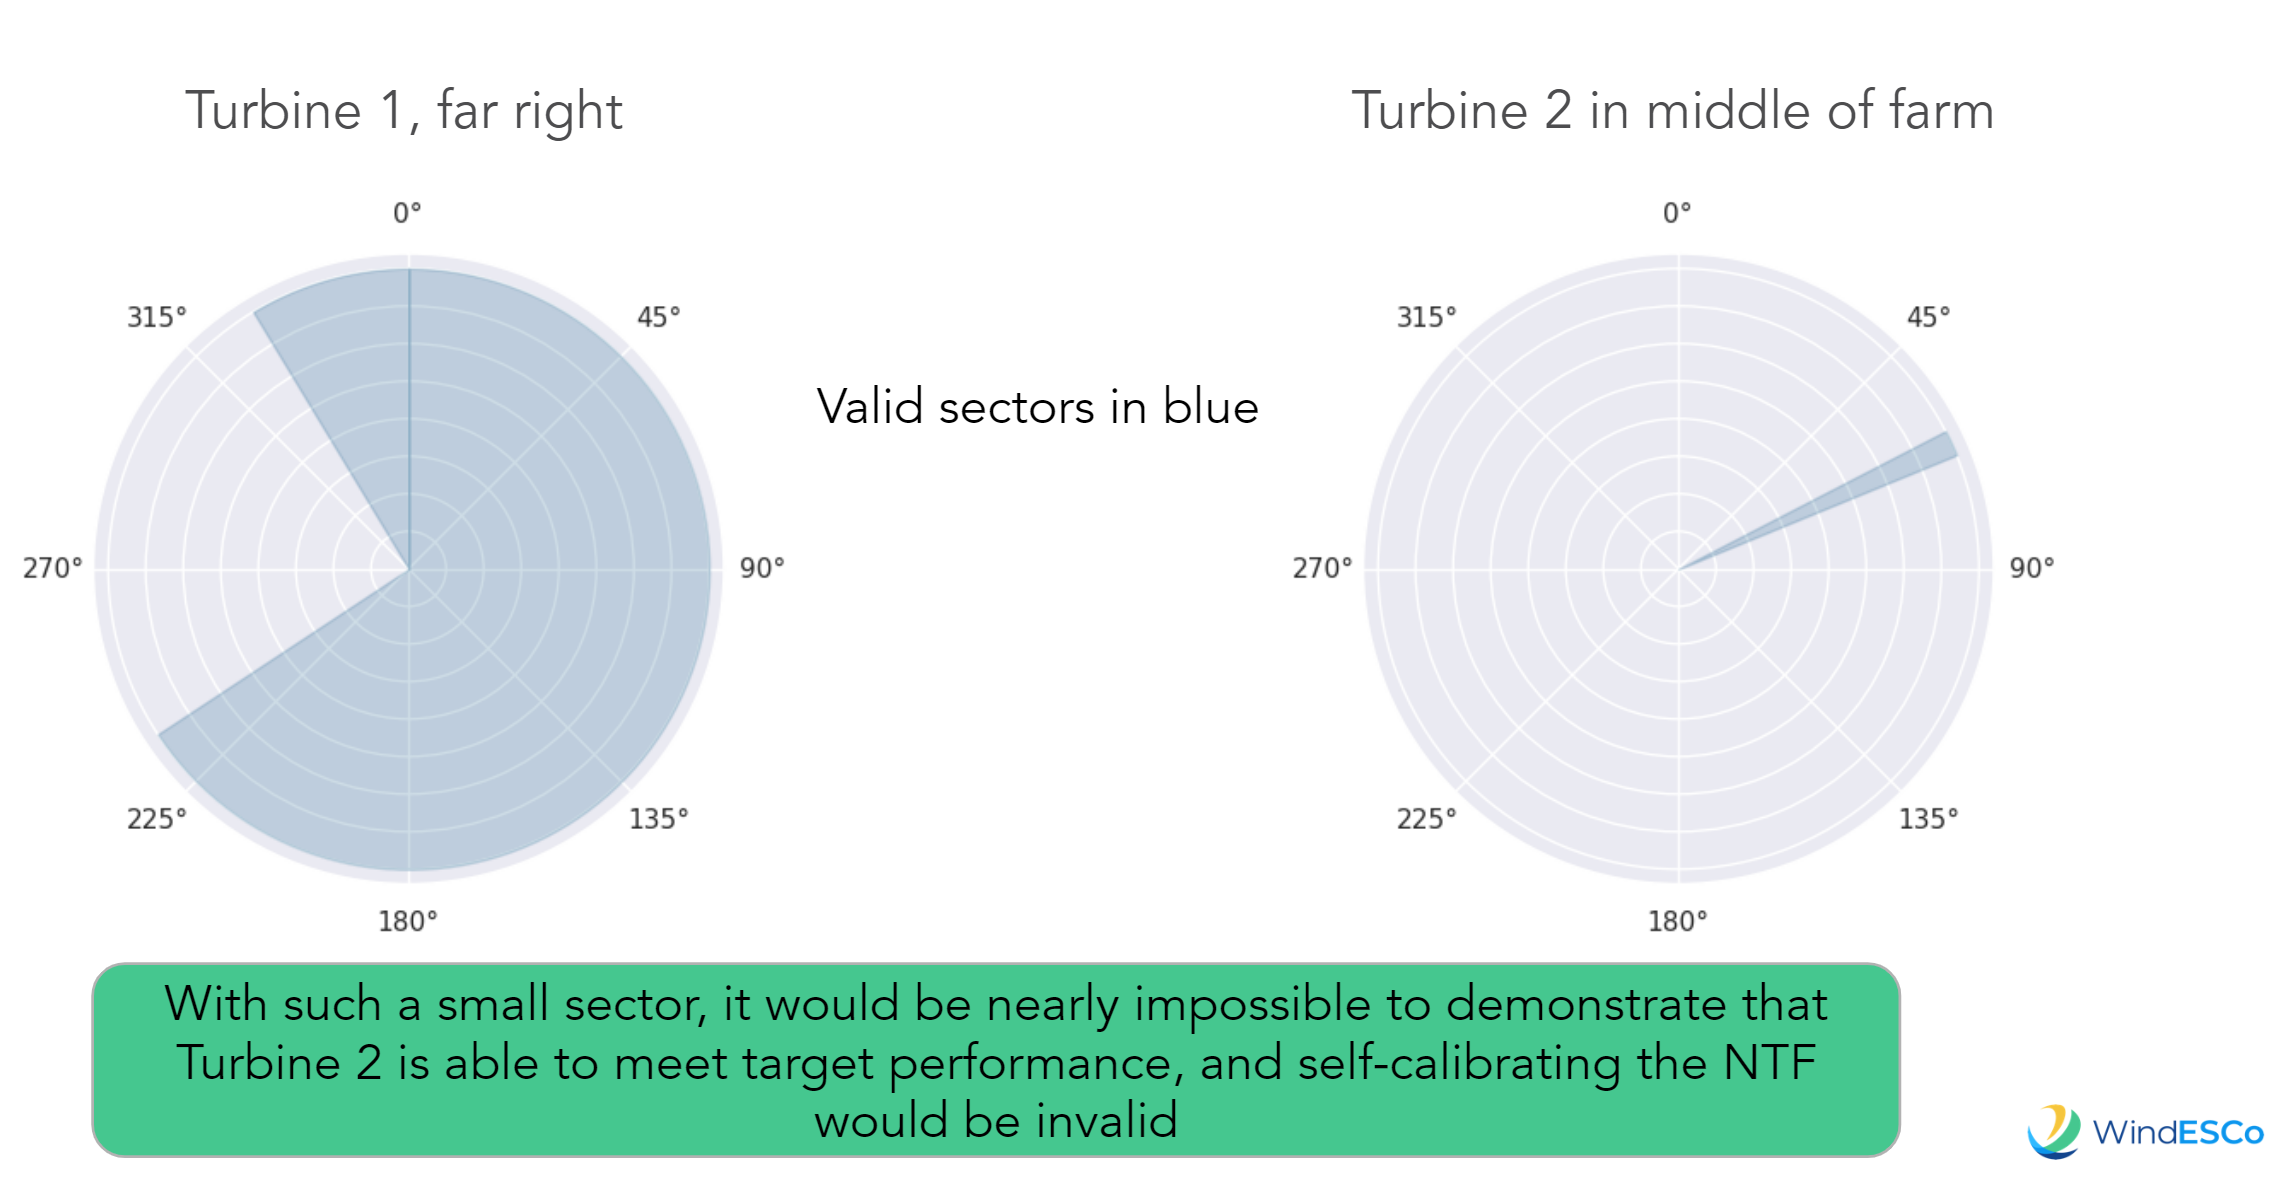
Certain sectors may be excluded based on distance to obstruction. The size of the sector depends on the equivalent rotor diameter of the obstacle and its distance from the test turbine.
Very quickly the valid sector can be reduced to a small region, so it does not represent actual performance. Data is separated into 10° direction bins
For example, at one farm that WindESCo analyzed there was a significant difference in the valid sectors based on the turbine location:
Site calibration

Directional and temporal shear may be measured and then used to calibrate the site and
correct for the variations in shear and direction. The different types of sites are classified as shown to the right
Type A - least complex terrain
Type B - moderate to complex terrain
Type C - most extreme terrain
To Fill the database:
Using method of bins, separate valid data into 0.5 m/s bins, centered on multiples of 0.5 m/s and the range must be 1 m/s below cut-in (and include parasitic losses) to 1.5 times the wind speed at 85% of the rated power.
The database shall be considered to be complete when it has met the following criteria:
- Each bin includes a minimum of 30 minutes of sampled data, i.e. 3 10-minute data points
- The database includes a minimum of 180 hours of sampled data, i.e. 1080 10-minute data points
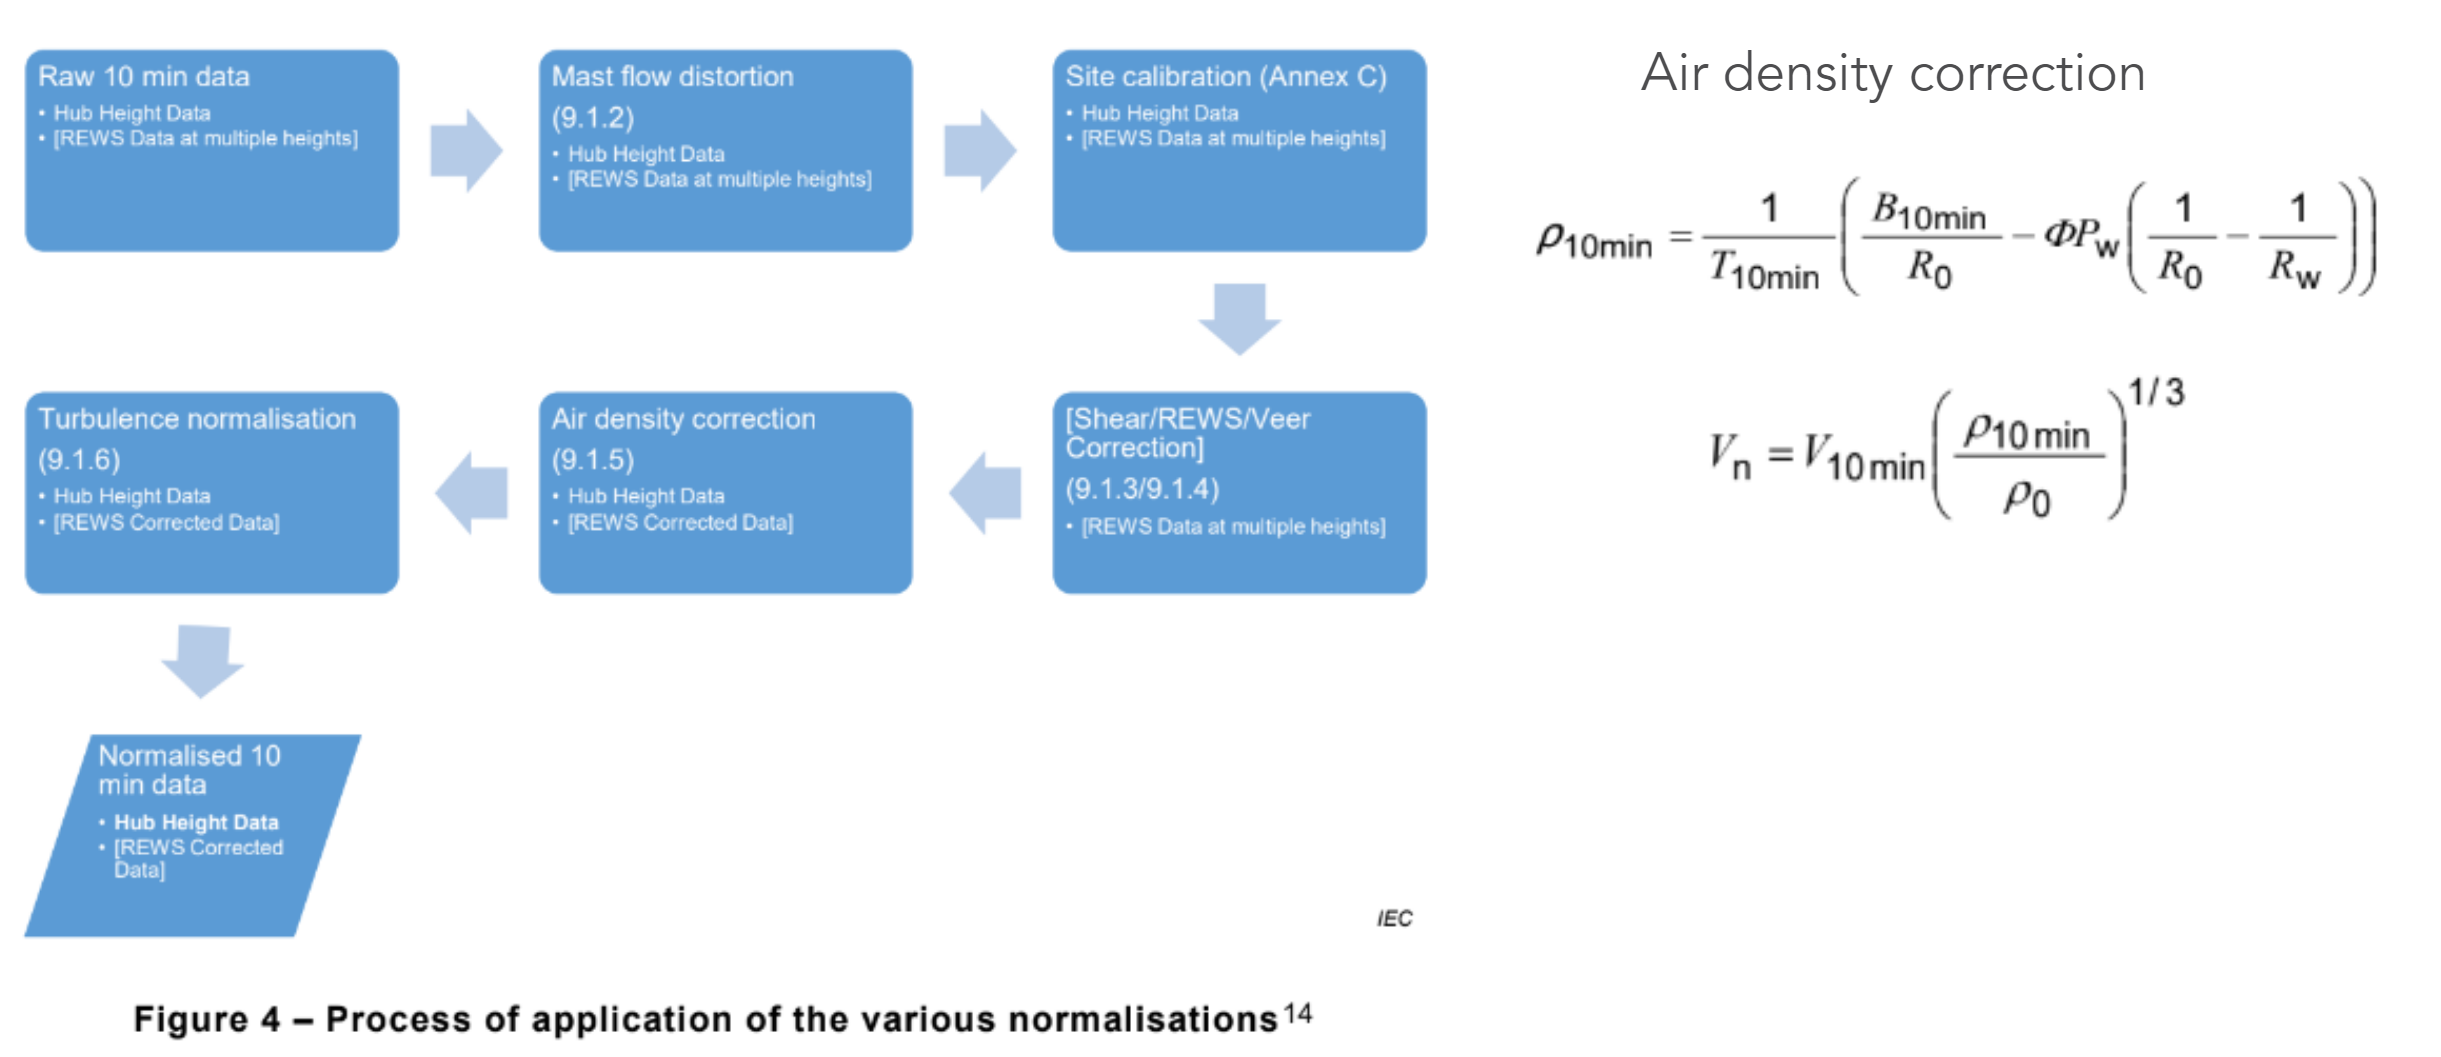
Data Normalization
The data is then normalized as follows:
Between the flexibility in defining the sectors due to obstructions, filtering the data by wind characteristics and the relatively low required bin counts for each wind speed bin, it can be deceptively easy to satisfy the OEM power curve certification requirements.
Turbulence, veer, upflow angle, flow distortion, site calibration
Turbulence (via turbulence intensity),
- Assumes that turbine follows a zero turbulence power curve - normalizing for turbulence should yield this curve. This process is described in Appendix M of IEC 61400-12-1 Edition 2, 2017-03
- Detailed iterative process that we should include in our analysis to help identify turbulence, temperature and other effects that may be conflated in the real world
- It must also include the uncertainties in this normalization because it is an iterative process based on simulations and simple modeling
This may remove about half of the observed effects of turbulence intensity on measured wind power curves
Veer and shear uses rotor equivalent wind speed however the wind speed with vary both in direction and speed as a function of height.- The variation will also depend on the characteristics of the terrain (hills, slopes, ridges) as well as the vegetation (forests, crops, etc) and structures (buildings, factories, etc) at the site.
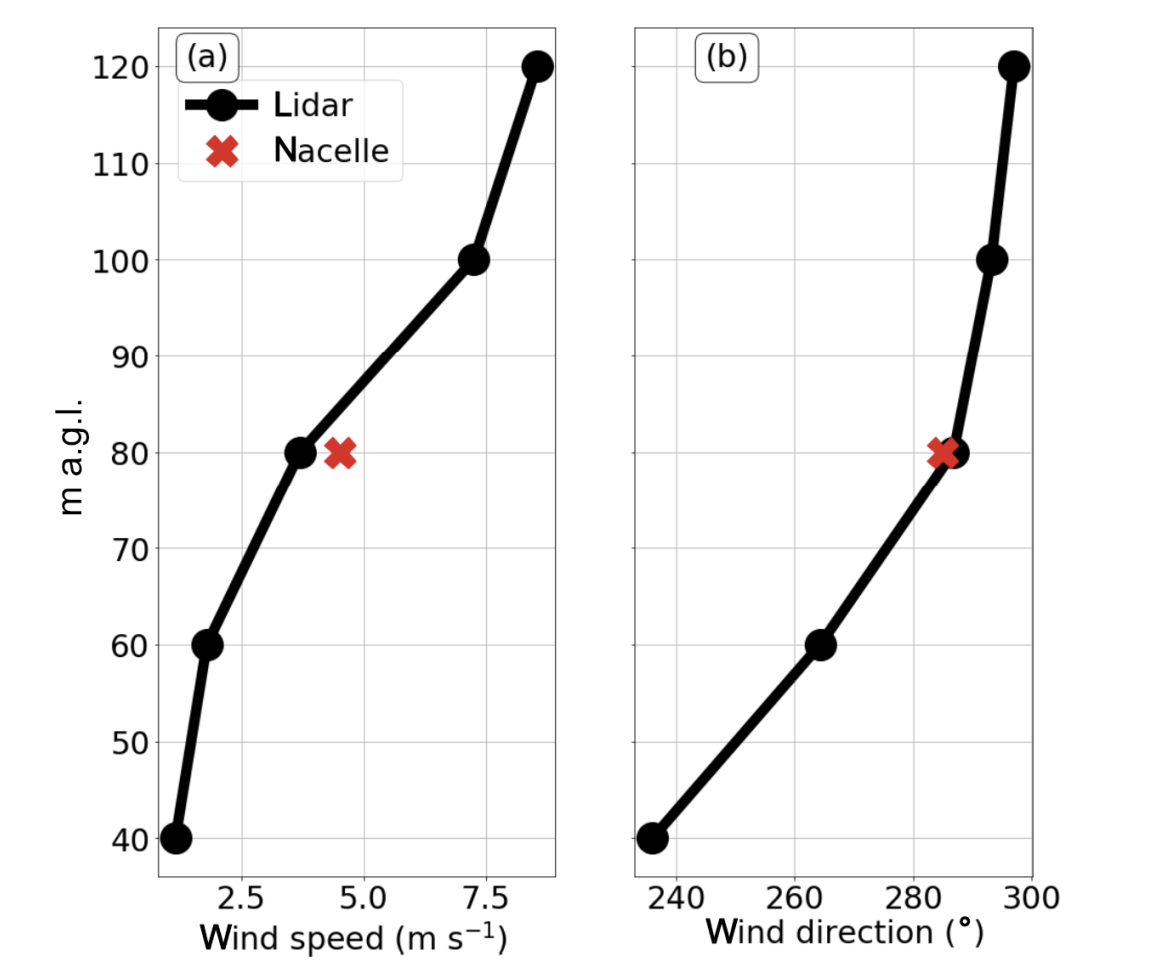
- Notice that the figure on the left, which is real wind speed measurements, does not fit an exponential profile defined by the wind shear equation.


In this figure, the left plot shows how the wind speed varies with height (meters above ground level), and the right figure shows how the wind direction varies with height
As the shear and veer vary, the optimal nacelle orientation is not necessarily defined by the wind characteristics at hub height
Why does TI affect power curves?
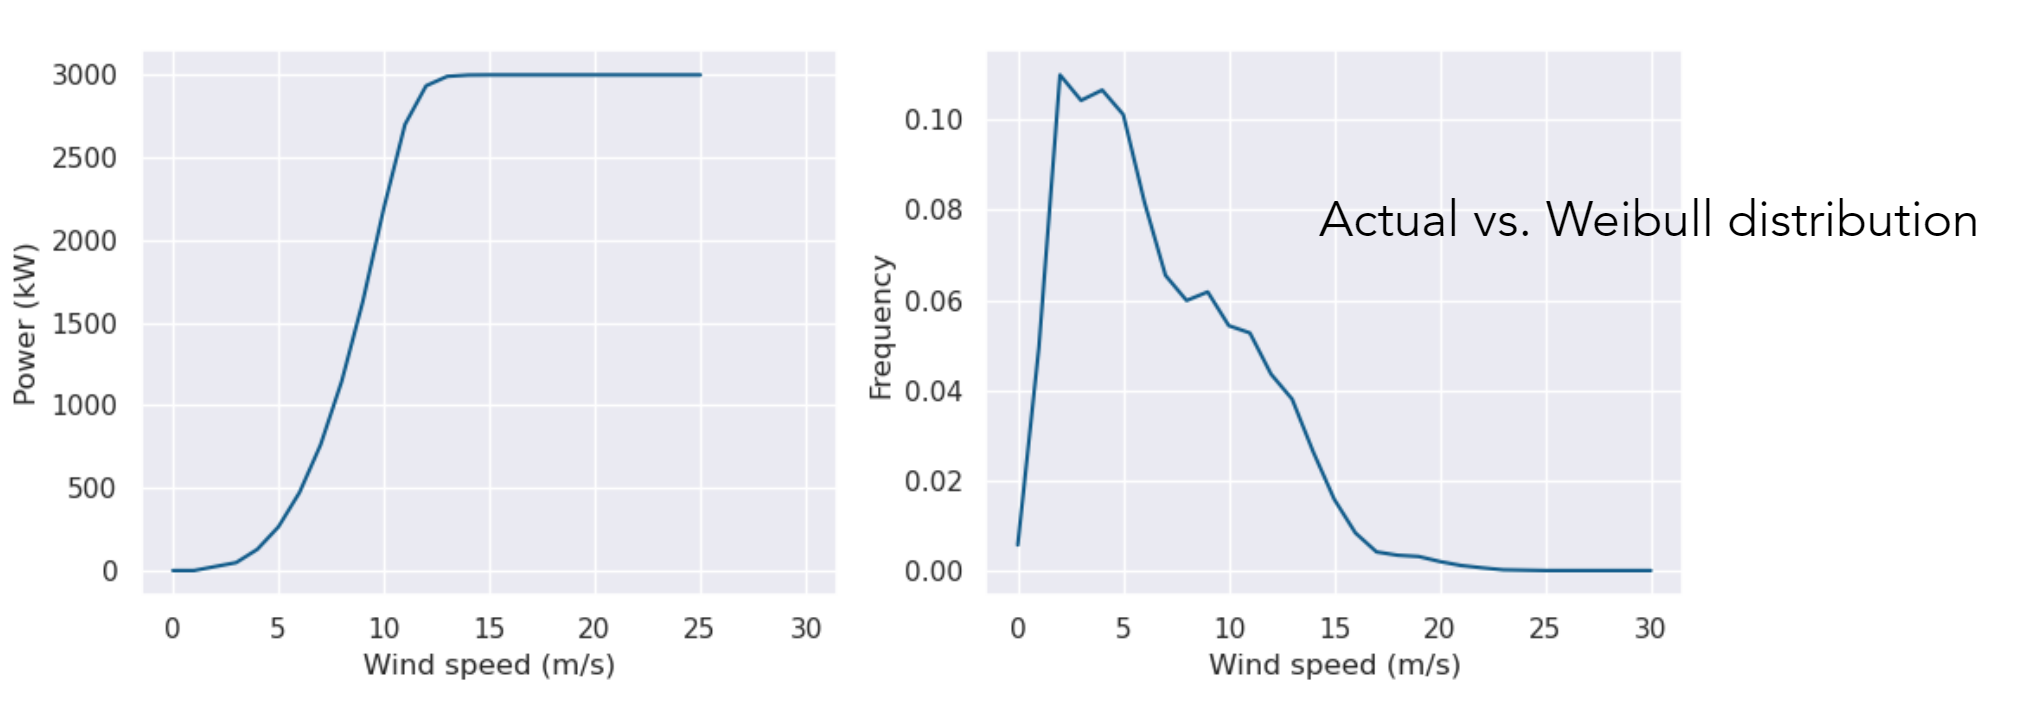
In Region 2.5, the transition from Region 2 to Region 3, the wind speed - power relationship is changing. Above the rated wind speed, the power is constant, so high winds do not generate more power because of this nonlinear behavior.
A wind flow with significant TI will be transitioning across this region, and the average wind speed and power do not have the same relationship as lower wind speeds. The example below shows how the frequency of the wind can also affect the power
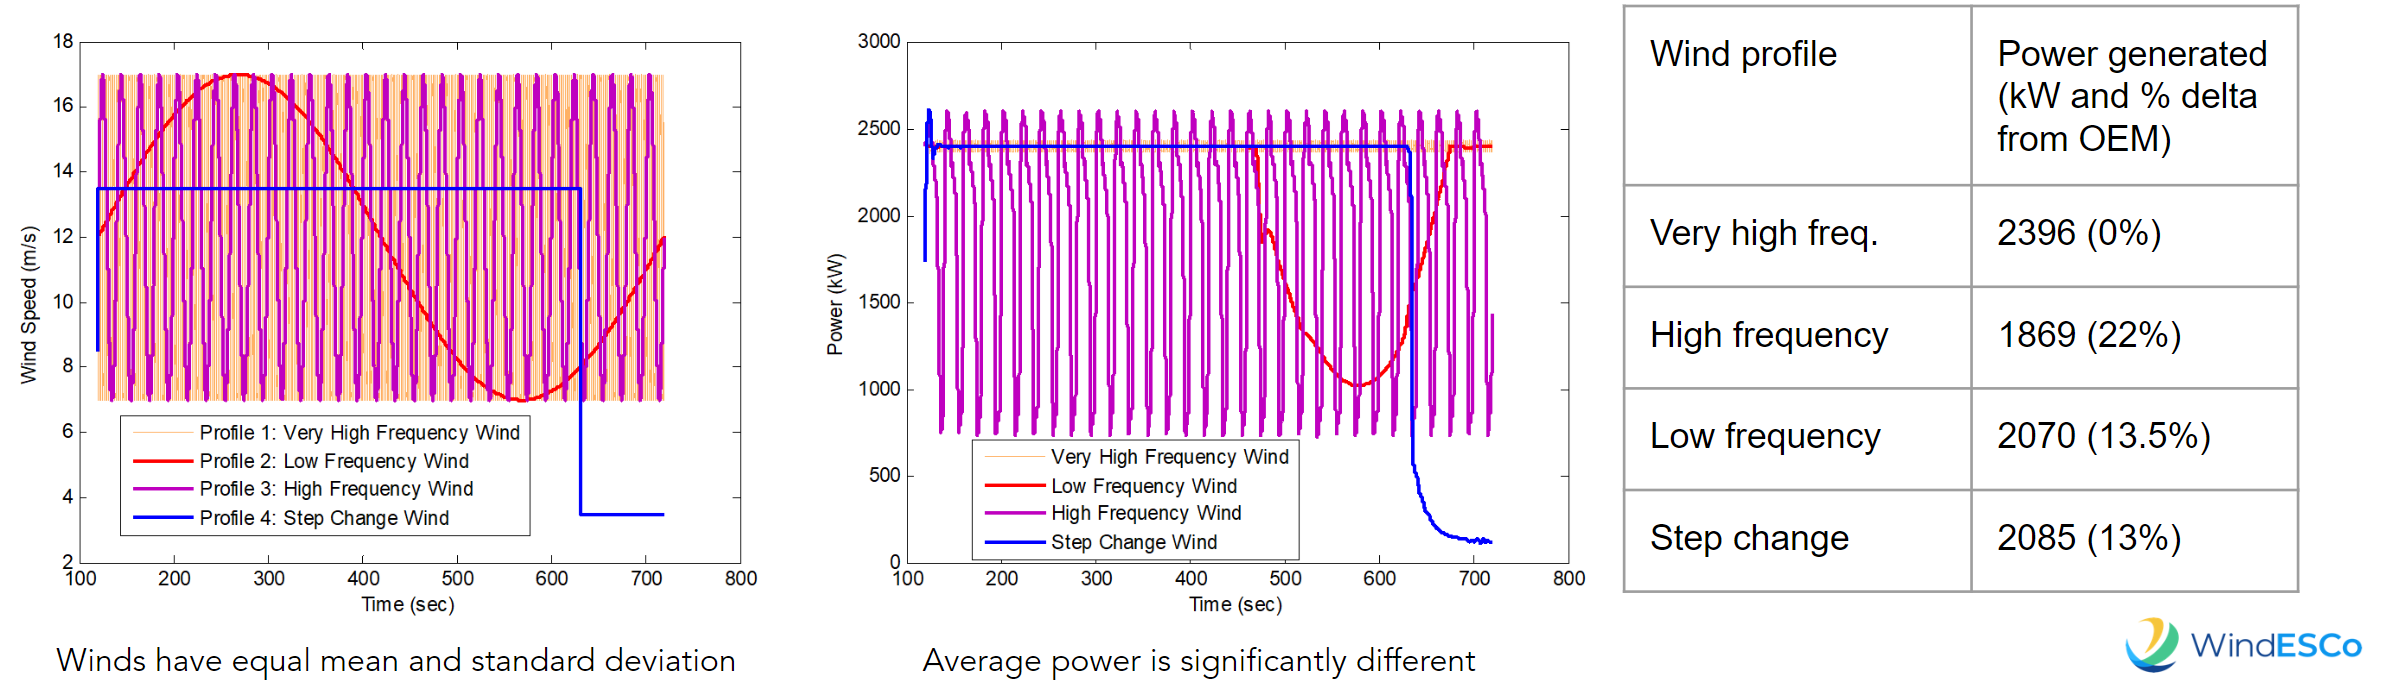
In summary, Wind variability and frequency content affect the power due to mechanical effects.
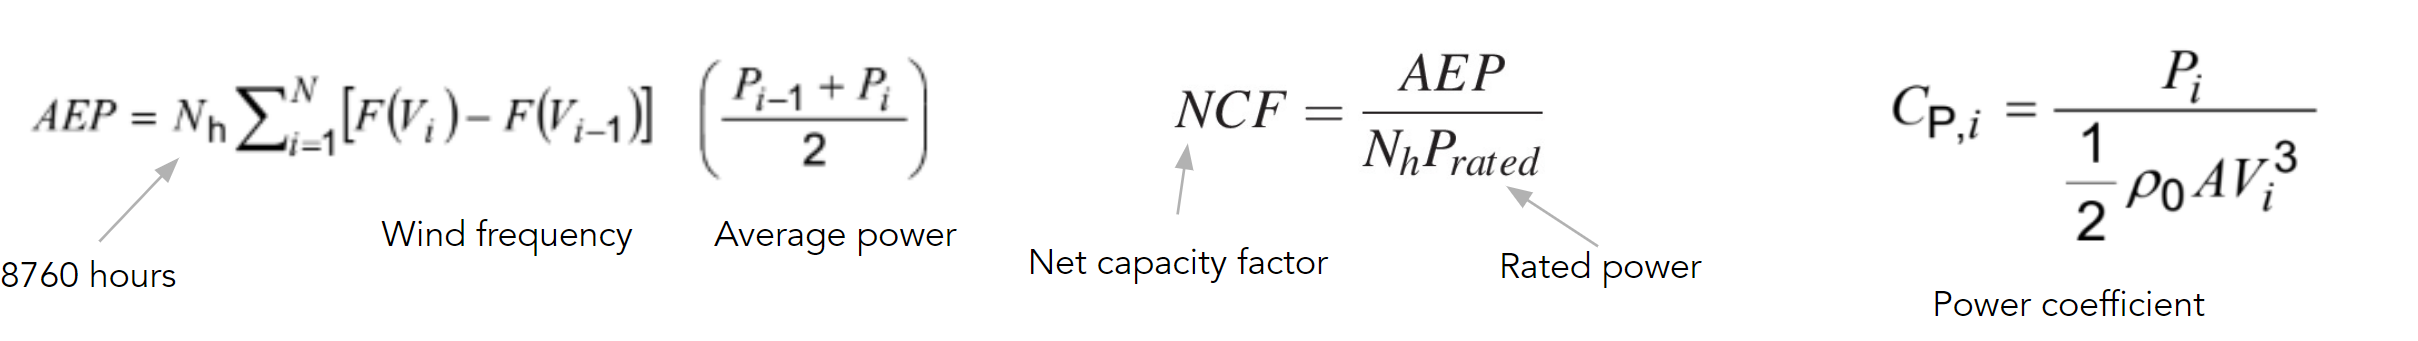
AEP Estimation for the Power Curve Certification
The power curve certification also will assume 100% availability for a site, which is an idealized state that is unlikely to be achieved.
To calculate the AEP, the following calculation is used:
Pulling it all together
In this example, August had TI values beyond the design specifications for the turbine. To meet the OEM curve, two approaches were taken:
- Tune a new controller for August data (red squares)
- Eliminate August high TI data using TI filtering rules from IEC specification
Both approaches were able to meet the curve

However - if the August TI behavior is repeatable and common, the site operators would see significant deviation from the power curve performance! In summary, power curves are not useful for evaluating performance because they are sensitive to so many parameters and conditions
Continue this series by understanding how accurate wind speed measurements are both essential and unreliable.