
A detailed explanation to the REWS and why it is important to understand in site analysis
In our last discussion we reviewed NTFs and their shortcomings.
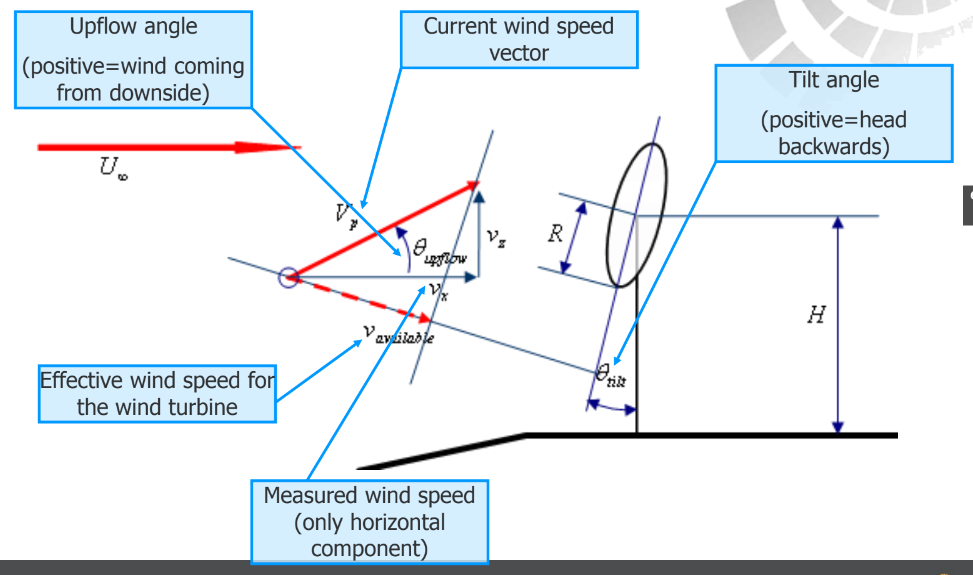
The Rotor Equivalent Wind Speed (REWS) is defined as the uniform wind speed vector perpendicular to the rotor area that has the same potential power as the actual wind vector field, i.e. the effective wind speed that interacts with the blades to generate power
- Only the component of the wind that is perpendicular to the rotor plane generates power
REWS is a better representation of the available power to the turbine, and therefore its efficiency, than the Horizontal Hub Height Wind Speed (HHHWS), which is what is typically measured at the nacelle anemometer. In sum, REWS is a theoretical approach to represent the wind energy available to the turbine more accurately than wind speed (and the shortcomings of an NTF).
This more sophisticated wind representation includes:
- Rotor axis tilt
- Upflow angle - complex terrain affects this significantly
- Veer - change in wind direction as a function of height
- Shear - change in wind speed as a function or height
OR
- Wind speed vector (typically measured from LiDAR)
- x (perpendicular to rotor)
- y (parallel to rotor)
- z (vertical)
These measurements allow the creation of a wind spatial distribution of all three components across the entire rotor swept area.
Note:
- Large wind turbines are slightly tilted backwards to help the turbine capture more wind energy.
- When the turbine is facing directly into the wind, the blades can stall.
- Tilting the blades slightly backwards helps them to maintain a consistent angle of attack, which maximizes energy production.
- Additionally, tilting the blades backwards also helps to reduce stress on the turbine's components, resulting in a longer lifespan for the turbine.
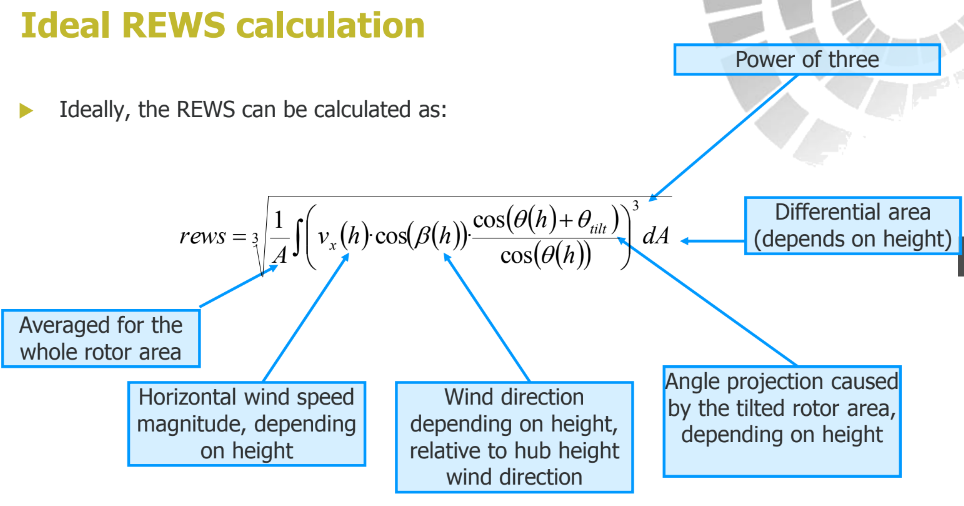
Calculation of REWS
In practice, this equation can be summed over both vertical and horizontal coordinates over the rotor plane. At each small area dA, the shear and veer can be calculated or estimated.

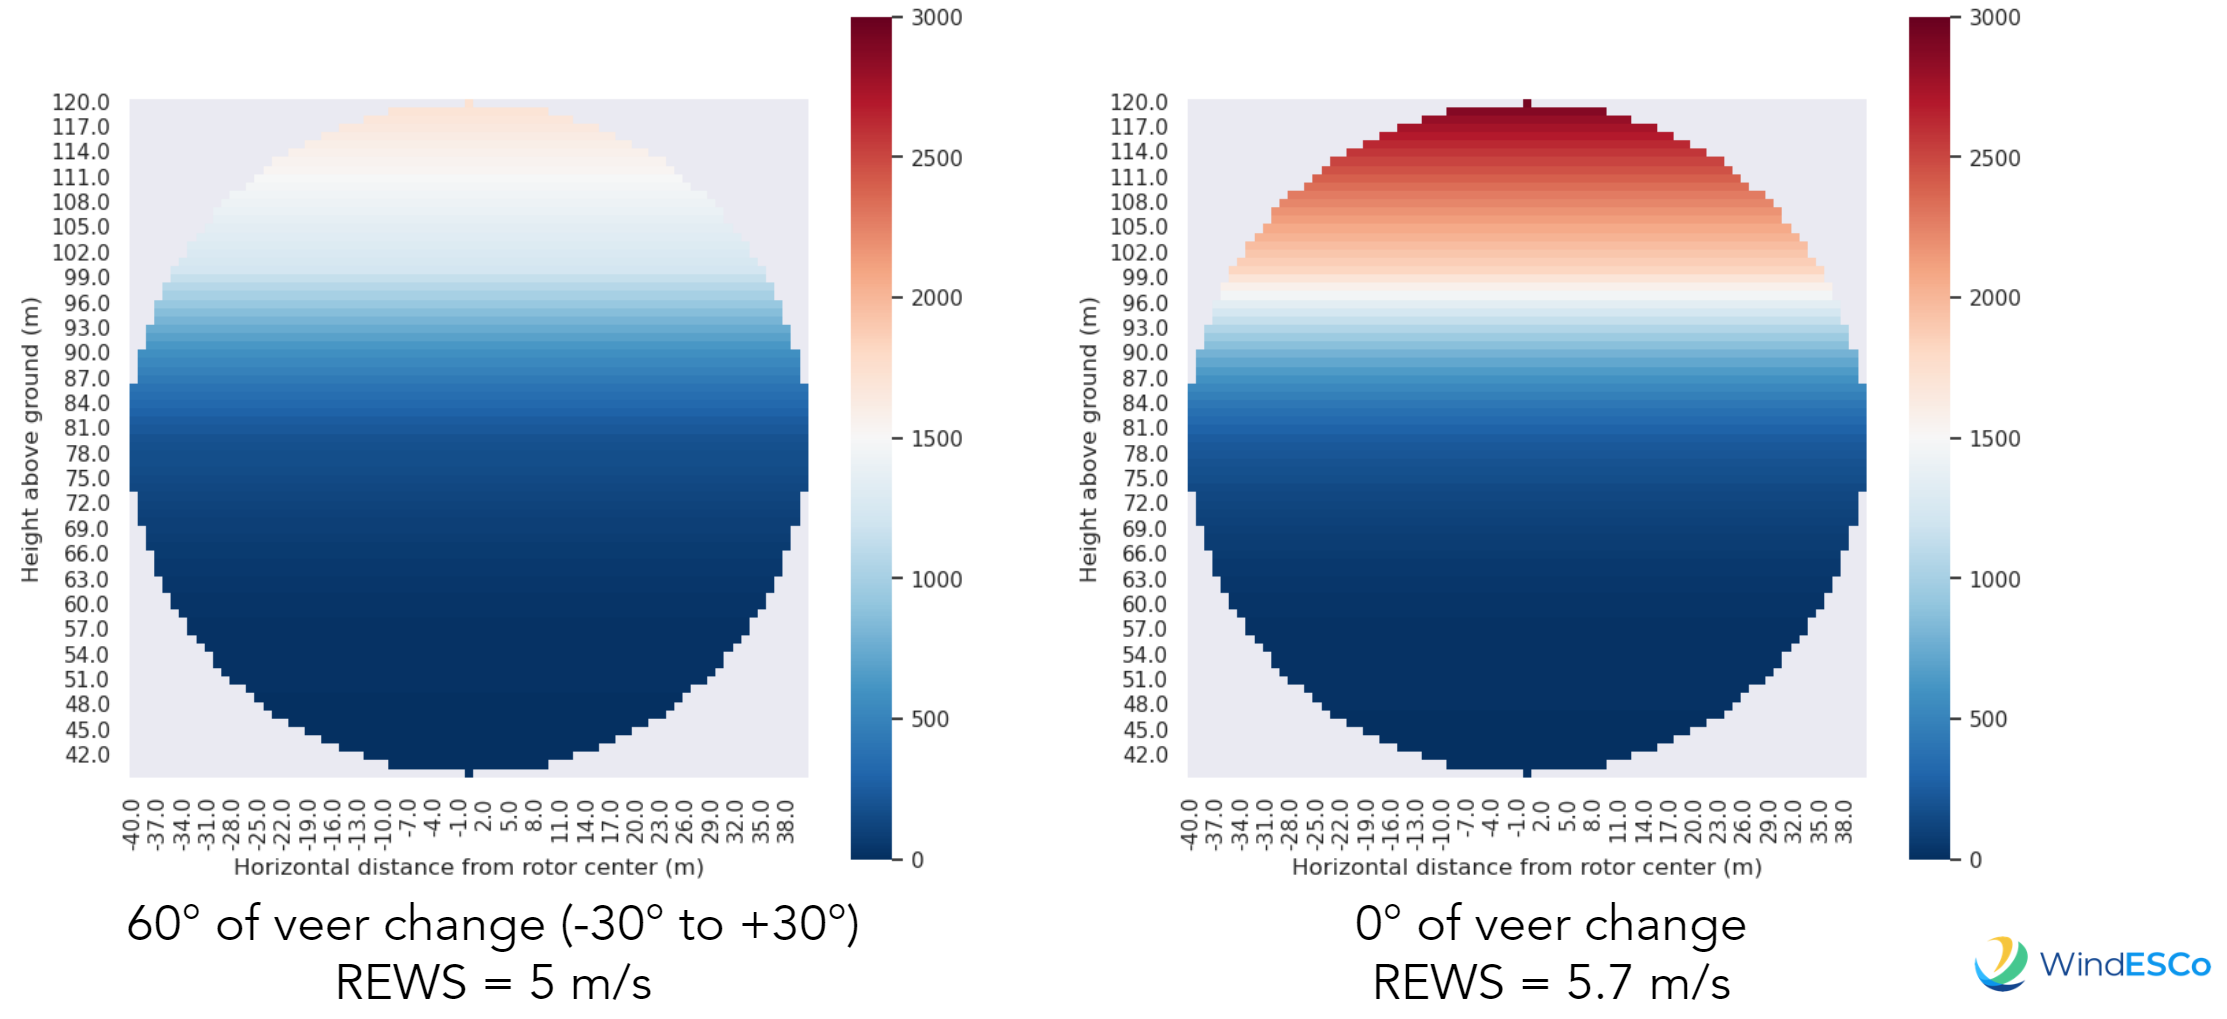
REWS example sensitivity to wind veer
Simulation of power across rotor plane with wind shear, but with and without veer.
Note that veer significantly reduces power at top of rotor, where the wind speed is maximum
REWS Implications
Hub height wind speed measurements may over-represent the energy available for the turbine
- The rotor swept area is about the size of a regulation soccer pitch
- The anemometer is about the size of a soccer ball
- This is only a snapshot of one portion of the wind speed
Nacelle wind speed measurements can be misleading about total available energy. REWS attempts to describe the wind more accurately, but it is difficult to implement in practice. For example, it is difficult to implement in the field without assumptions on veer and vertical angle, and it it is not possible to simply interpolate power curve for a given power measurement.
While calculating REWS is not always practical or possible, it does raise some important questions when evaluating turbine performance
- Upflow and veer can significantly affect the generated power
- The nacelle measured wind speed may not be capturing the true wind available
- Parameters such as Cp and TSR
Continue onto the final article in the series pulling it all together: Interpreting power curves and the NTF.