
Understanding the key sources of site underperformance and limitations of power curve certifications
Due to the complexity, this will be a multi-part series addressing the key elements that may contribute to site underperformance in comparison to a power curve certification.
Performance tests are completed during initial site assessments, which has many drawbacks:
-
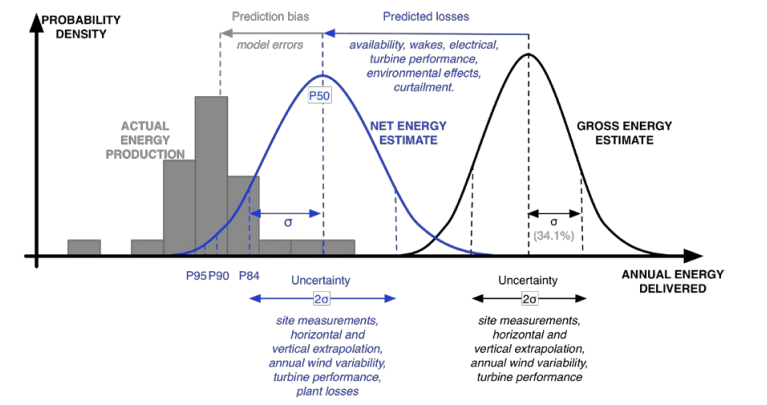
- Designers estimate a gross energy based on wind measurements at the site and the turbines, and then include uncertainties such as extrapolations
- This estimate is then reduced by availability modeling, wakes, etc to generate two estimates for 1, 10 and 20 years
- P50 - the amount of energy that has a 50% probability of being exceeded
- P90 - the amount of energy that has a 90% probability of being exceeded
-
- Poor initial modeling
- Poor turbine performance
- Adjacent farm wakes
Overview of the Power Curve Qualification
During turbine qualification, a power curve may be certified for the turbine model at a given site. This has historically been an involved process that includes met towers and a single turbine certification for the entire site:
- Challenges for placement, calibration and maintenance of met power
- Does not accurately represent conditions throughout the year
Later standards allow the nacelle anemometer to be used to qualify a power curve, which allows all turbines to be qualified, but also places greater emphasis on accurate wind speed measurements. The gold standard for power curve certification is IEC 61400-12-1:
- IEC 61400-12-1 Edition 2, 2017-03 allows for LiDAR and rotor equivalent wind speed (REWS)
- Updated from just met mast, driven by industry and power curve working group (pcwg.org)
- IEC 61400-12-2 Edition 1, 2013-03 describes the power measurement processing using nacelle anemometers, as well as generating nacelle transfer functions
- ISO 2533 describes how to calculate standard atmosphere quantities, in particular, air pressure and air density (page 4)
Power Curve Certification Basics
The following are all elements that impact the power curve certification:
- Measurements wind speed and air density
- What is providing the wind speed and air density input into calculations?
- Hub height or rotor equivalent wind speed
- Estimate shear and veer using multiple height measurements
- Turbulence
- Air density (hub height) requires relative humidity and atmospheric pressure (or assume 50%)
- How is it measured?
- Met mast
- LiDAR
- Spinner anemometer
- Nacelle anemometer
- 1 Hz sample rate, calculate 10 minute stats (mean, min, max, standard deviation)
- What is providing the wind speed and air density input into calculations?
- Defining suitable measurement sector and excluded sectors via site calibration
- Location of met mast (2 to 4 times rotor diameter in front of turbine; 2.5D is recommended)
- Topographical variations and roughness
- Other wind turbines and obstacles
- Data exclusions
- Turbine faults, icing, outside measurement sector, outside site calibration sectors, special atmospheric conditions
- Normalization and uncertainty calculations
- Turbulence, veer, upflow angle, flow distortion, site calibration
- May have diurnal effect, based on solar heating
Any one of these assumptions will change the performance of the power curve. Remember, certification demonstrates that the turbine CAN perform to its OEM power curve, not that it WILL perform that way!
Continue the series by checking out our knowledge base that is a deep dive on understanding power curve certifications elements!