Reviewing and understanding KPI cards in WindESCo's portal
Overview of KPIs:
When you log into the portal for the first time, you will notice that there are several key performance indicators tracked in the cards at the top of each page. These could be confusing the first time you see them, so let’s break them down one-by-one. When looking at the home page, you will see a roll up of all sites. In the first box you will see a roll up of the total capacity and turbines under analysis (and the number of sites as well):

In the second card, you will see an overview of the number of individual turbine issues that need attention, that are open, that are fixed, and how many turbines are impacted by those open issues. You can also see the number of issues that have already been corrected.

In the third card, we can see the impact of the 206 open issues on annual energy production (AEP). AEP loss or potential gain estimates are based on the individual loss models created to characterize each issue. In this example,
- Open issues, if not corrected, would lose the plant $551,190/year. If fixed, the plant revenue would increase by that same amount.
- $551,190/year is equivalent to 3.4% performance losses across the sites
- $551,190 is equivalent to losing 8,150 MWh of production/year

Similarly, the 395 issues that have been resolved have resulted in an estimated increase of
- $886,040 of increased revenue/year
- $886,040/year is equivalent to 3.6% performance losses across the sites
- $886,040 is equivalent to losing 12,180 MWh of production / year

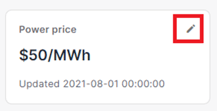
Now if we select one of the sites within this organization, we will see the KPIs have updated to reflect the specifics to that site and the PPA price used to make the calculations:

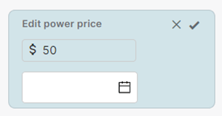
If you think the PPA price should be something else, please update it by selecting the “edit” icon in the top right corner and filling in the information:


Click the checkbox to save. As with selecting a specific site, if we select an issue, we will see our KPIs update to be specific to that issue:

If/when the issue is corrected, a gains card will be added on the far right:

Issue-specific KPIs:
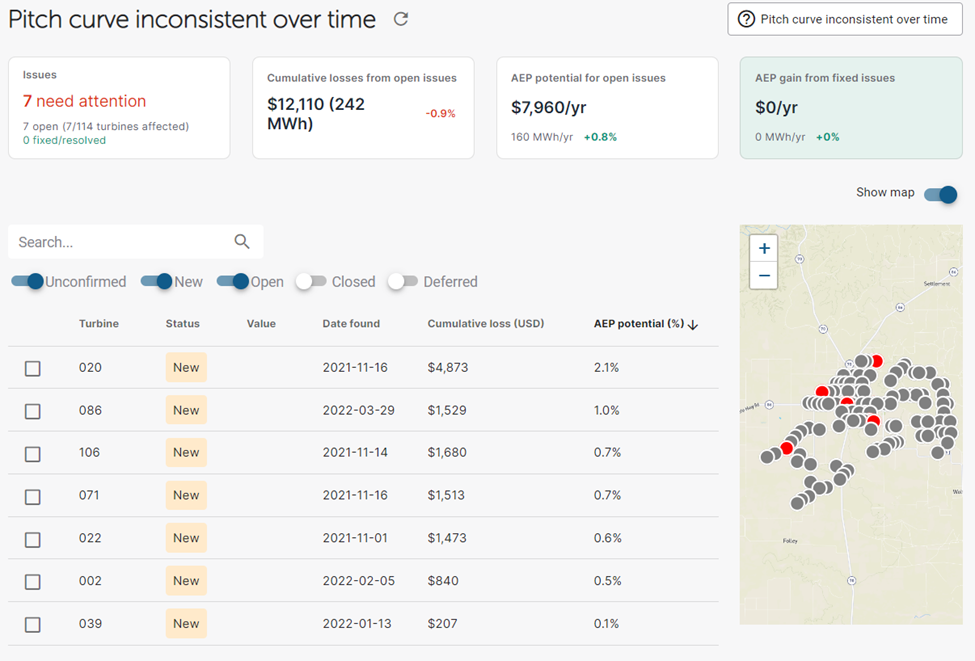
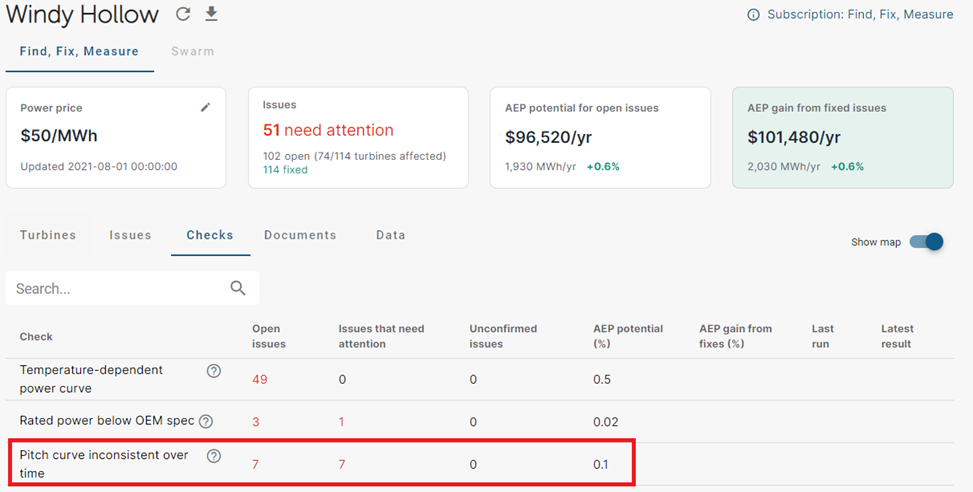
When you select an issue from the “Checks” tab, such as “Pitch curve inconsistent over time”, the KPIs will also update specific to that issue type. For example, in the below we see 7 turbines have this issue and for those 7 turbines the equivalent AEP opportunity is 0.8%.

This is a very large farm, however, so when related back to the total farm opportunity (across all 114 turbines), we can see the farm-level AEP opportunity is 0.1% AEP.

Understanding cumulative losses:
While many of our customers make decisions on what to correct based on the impact on an annual basis, it may also be important to understand the total losses since an issue was identified. In this image we can see the cumulative losses in red (For the second issue we can see $1,529 has been lost since the issue was found March 29th, 2022).

In blue, we can see the AEP impact for that issue on the individual turbine.
