
Understand how WindESCo investigates power curve scatter and if it's typical or unexpected behavior
- WindESCo investigates power curve scatter to determine if there are reasons for the spread, or if it is a natural consequence of the turbine behavior, and also compares the spread to other turbine models
- The turbines at the example "Site A" exhibit a spread within acceptable ranges
- Site A turbines reach rated power faster than some other turbine models, demonstrating higher efficiency
- At median wind speed for 50% of rated power:
- Site A turbines exhibit a power spread of 30% to 60%
- Comparison OEM 1 turbines exhibit a power spread of 25% to 80%. This is a high spread turbine
- Comparison OEM 2 turbines exhibit a power spread of 40% to 60%. This is a low spread turbine
- For the off-curve points, the cause is most likely wind behavior changes, such as gusts, wind direction changes, shear, icing, etc.
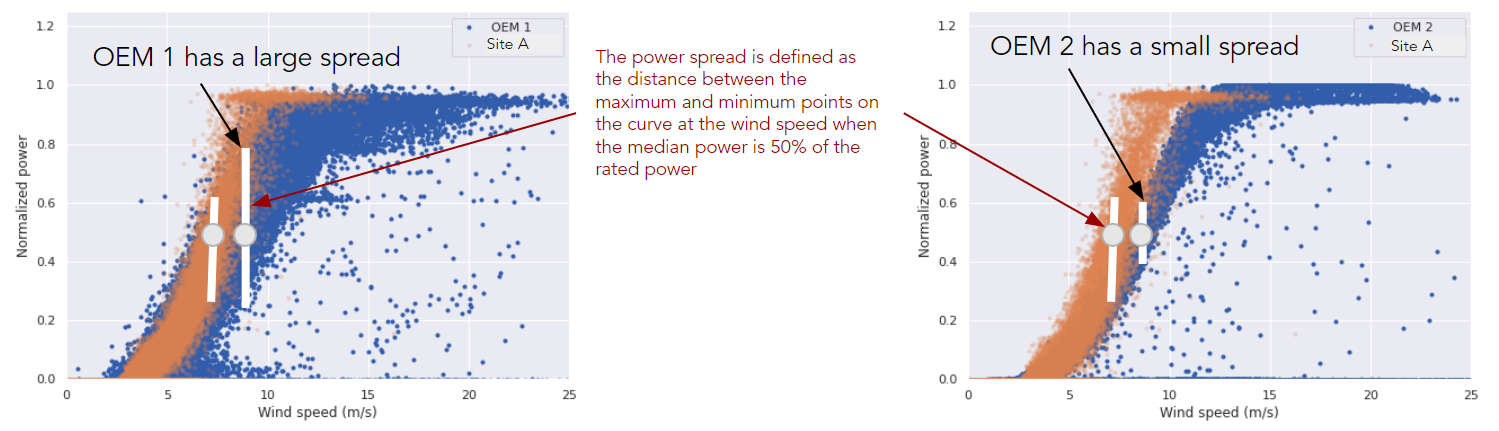
Step 1: Find the wind speed at which the median power is at 50% of rated power

Step 2: At that wind speed, find the max and minimum points, excluding outliers

Step 3: Calculate the spread as max - min

WindESCo uses this metric as an assessment of turbine behavior. It helps to identify if there might be other issues at the farm. This criterion does not have a pass or fail value, but, in general, a smaller spread usually represents a well-controlled turbine. The spread may also be affected by the behavior of the wind at the site, so it is not always just a turbine issue.