
Understanding loss model calculations and differences from an EIA
What is a loss model?
A loss model is an algorithm used to estimate the energy that is being lost, or alternatively, that could be gained by optimizing the operating conditions of a wind turbine. The specific loss model for each issue is chosen by our subject matter experts based on their extensive experience in wind energy, physics and engineering-based principles, the latest industry techniques, current academic research, and customer feedback. Loss models are a reliable alternative to provide customers decision-making information to improve the performance and reliability of their wind farm.
To calculate the losses for a given issue, WindESCo leverages loss model calculations specific to the issue and actual wind and turbine measurements to ensure that an accurate estimation is provided. For example, static yaw misalignment has a loss model that uses a cos-squared relationship for the Region 2 power loss. In contrast, the issue “Pitch curve inconsistent over time” uses a fractional loss model by applying a loss fraction to the filtered power data, which assumes a constant percentage power loss over the relevant portions of the power curve below rated power.
How to understand a loss model:
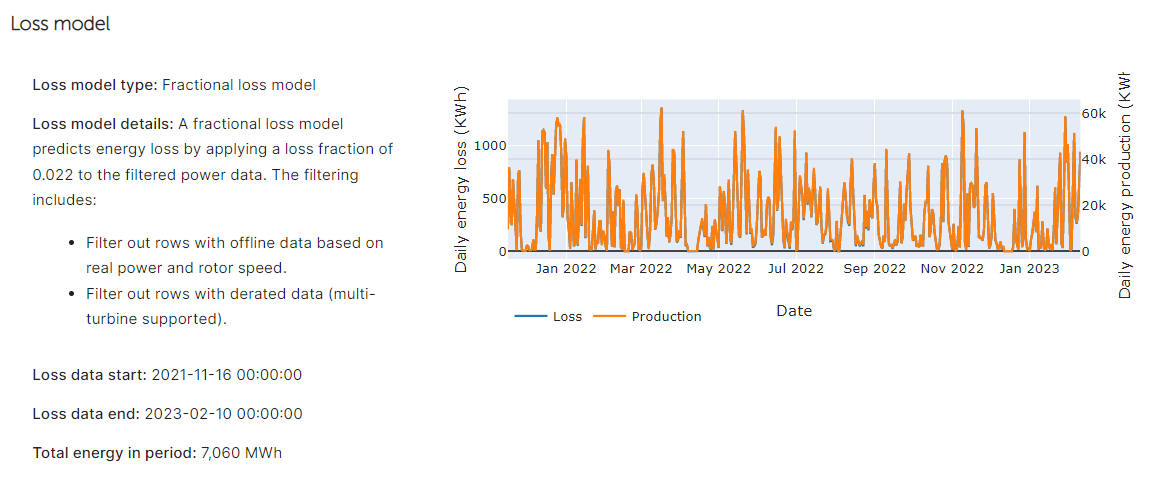
Each loss model analysis includes a high-level description of the approach. The loss analysis also includes a graph of the estimated energy loss and the total energy produced for the given time period of the loss. Our goal is to provide enough information so that everyone understands the assumptions made and can agree, or disagree, with the approach and loss estimates through their own validation process.
In the two examples below, the text on the left provides information on the loss model type, the fractional loss magnitude, the regions for which the loss is applied, and the start and end dates of the estimated energy loss.
The plots on the right provide visual information of the Daily energy production (orange) on the right vertical axis and the Daily energy loss (blue) on the left axis. Note that the vertical scale of the axes may be significantly different. This allows a comparison of not only the magnitude, but also the times at which energy is lost. It is important to observe that the energy loss is the magnitude of the blue curve, not the difference between the blue and orange lines. For the yaw misalignment loss model, the energy is only lost in Region 2, so there are times when the loss and production differ (for example, July 2022). However, for the fractional loss model, the loss curve shape is similar to the energy production because it is a direct scaling of the total energy.

For a full list of the loss models that WindESCo uses, please refer to our Glossary.
How is a loss model different than an Energy Improvement Assessment (EIA)?
When an issue is fixed, the gains are tracked through an inverse of the loss model, that is, what the losses would have been if the issue were not corrected. To ensure that gains are not tracked when a Fix is incorrectly applied, WindESCo continues to review for all issues on a continuous basis. Any issue that is re-identified will then have their gains appropriately adjusted to reflect that the issue was not properly addressed.
One significant advantage of the loss model approach is that it allows customers to implement correct several issues in parallel and continuously track estimated gains, rather than conduct a traditional measurement campaign (correct one issue, collect data, evaluate, repeat for each issue). Loss models are intended to be illustrative and approximate in order to support decision-making in site improvements rather than a precise measurement technique.
In comparison, WindESCo’s EIA approach is a DNV-approved, side-by-side power comparison tool using machine learning to calculate the impact of changes in static parameters, sensors, or mechanical features of individual turbines on the turbine's power generation. The EIA is a robust tool that requires three months of data to develop a baseline, as well as three months of data after an implemented change to calculate the gains. (To learn more, please refer to the EIA Methodology knowledge page.) While very powerful, the EIA has several drawbacks including:
- Requiring six months of data (at least three months before and three months after)
- Vulnerability to the seasonal variations in meteorological characteristics on the wind farm site (this can cause control turbines to have a low similarity score between the control and test periods meaning the results cannot be considered reliable)
- Sensitivity to site-wide and turbine-specific changes at the farm – if, during the course of normal operations, other changes are introduced on the wind farm that does not leave sufficient control turbines then results can be invalidated, including examples such as turbine maintenance and repair, blade cleaning, software upgrades, hardware modifications, etc.
Given the practicalities of running a wind plant, it is challenging to ensure the criteria for an EIA can be fulfilled in all circumstances. Therefore, WindESCo developed the loss models as alternatives to provide customers decision-making information to improve the performance and reliability of their wind farm.
Why didn’t WindESCo use another modeling approach?
WindESCo is continuously reviewing leading literature on energy performance calculations and the advantages and disadvantages that come with each approach. As further information is released, we will continue to refine our calculations to stay consistent with leading industry practices. Have a suggestion? Send it our way! We're always open to reviewing suggestions and trying to improve calculations to the best of our abilities.