
Reviewing content in the analytics tab
WindESCo released (June 2023) an Analytics tab that can be views on a site-level detail. To view it, go to any site and look to the far right
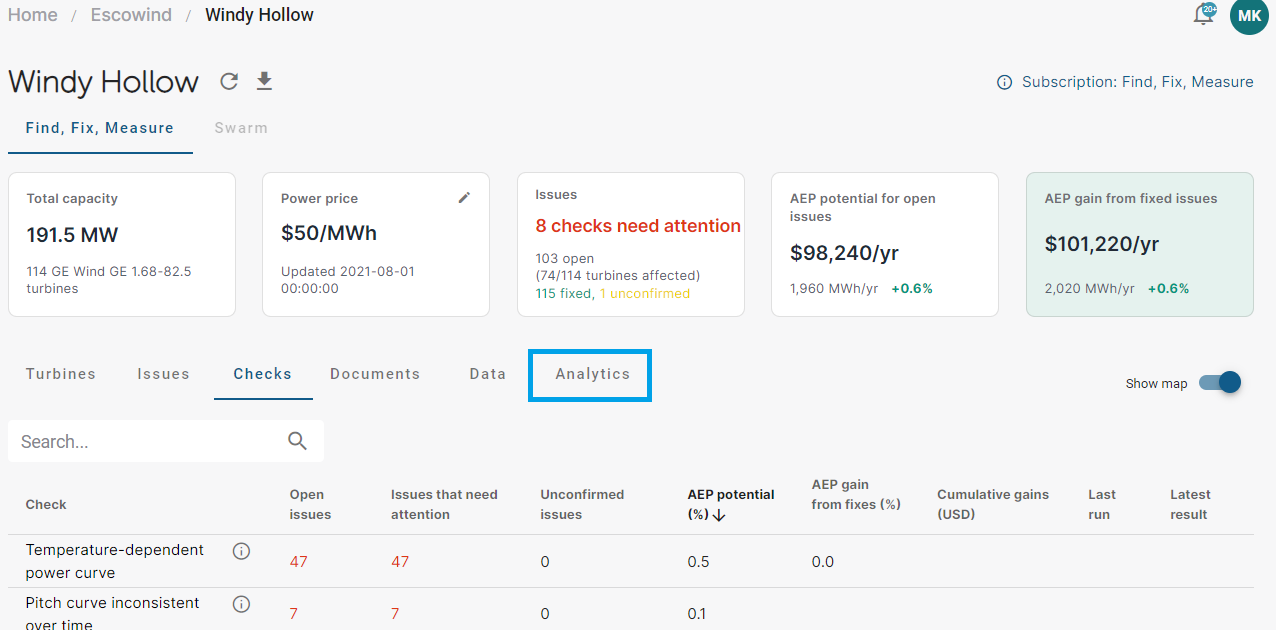
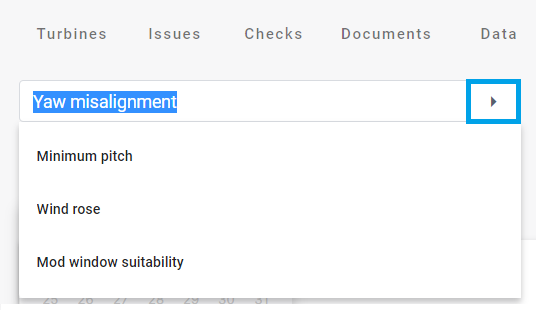
When you click the tab, you will see a few drop down menus and a graph. The benefit of this tab is to show a 'live look' at some of the common issues found on a site for a deeper analysis. For example, yaw misalignment's evolution over time (whereas an individual issue will have static evidence from when the issue was identified).
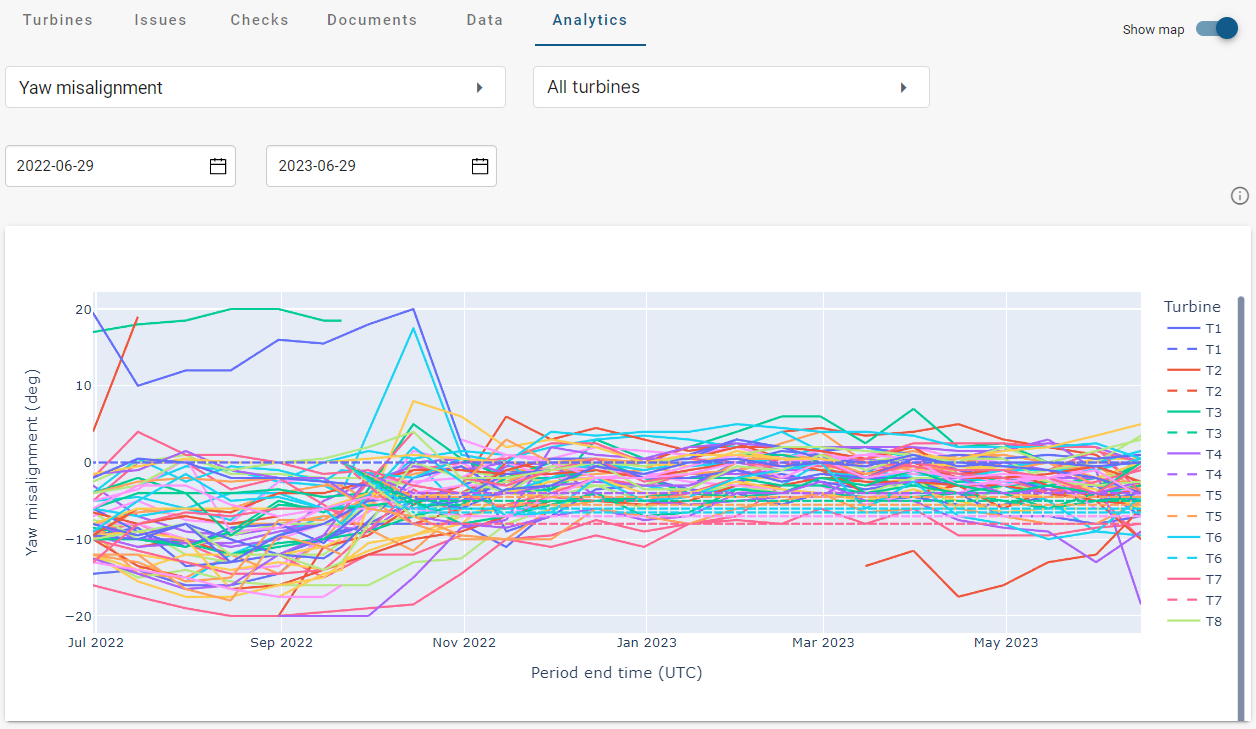
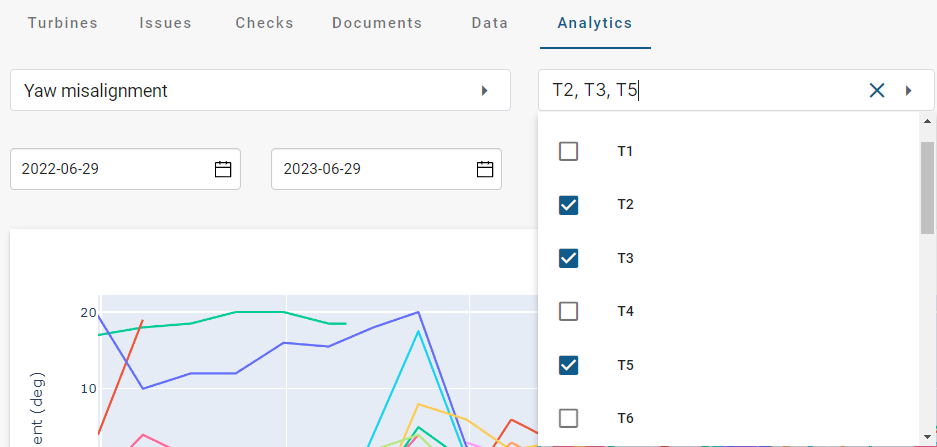
The graphs can be adjusted to select a subset of turbines,
Or a specific time range,
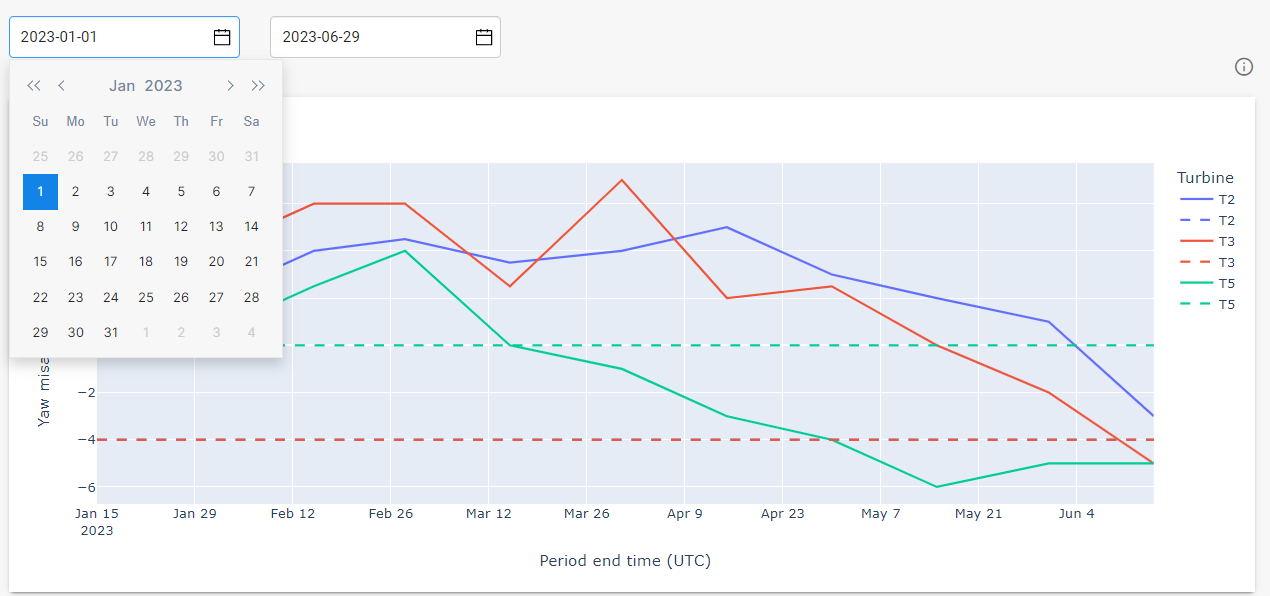
And you can see all the available options by clicking on the arrow (carrot).
Note that many additional analytics will be released over time! We will also be integrating additional live evidence into issue detections so users will be able to compare the initial issue and if it has continued since it was identified. If you have a suggestion for a specific view that would be particularly useful, please let us know.